Accessibility of STEM Diagrams
Part 3:
- Using accessible diagrams on the Web
- Generating accessible diagrams
Overview
- I given introduction to our work, explain some of the technical details.
- Let you work with different types of accessible diagrams
- Chemistry, Physics, Statistics
- Let you generate some accessible chemistry diagrams
- Followed by a question, feedback, discussion session
What you need
- A browser (any will do!)
- A screen reader
Goal of our Work
- Diagrams are an important teaching means in STEM
- Accessibility is key to inclusive education
- Avoid additional hurdles for both authors and readers
- Fully automatic to reduce need for human intervention
- Source independence
- Do not rely on the benevolent, educated author
- Tool Independence
- Do not force readers to use a specialist software tool
- Platform independence
- Accessible with all browsers, screen readers, on all platforms
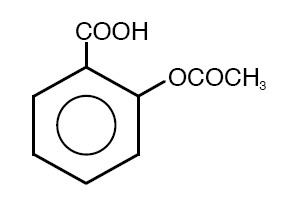
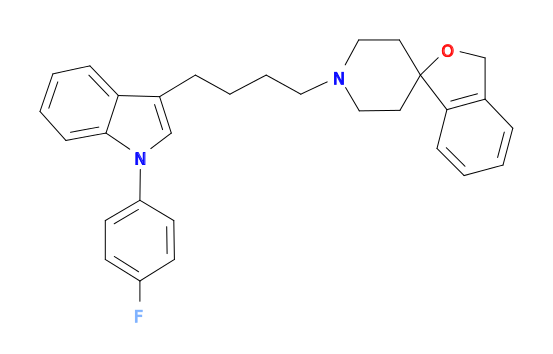
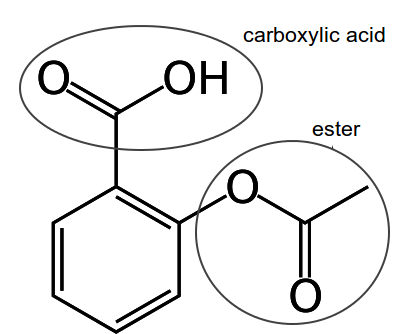
Chemistry Examples
Displayed formula.
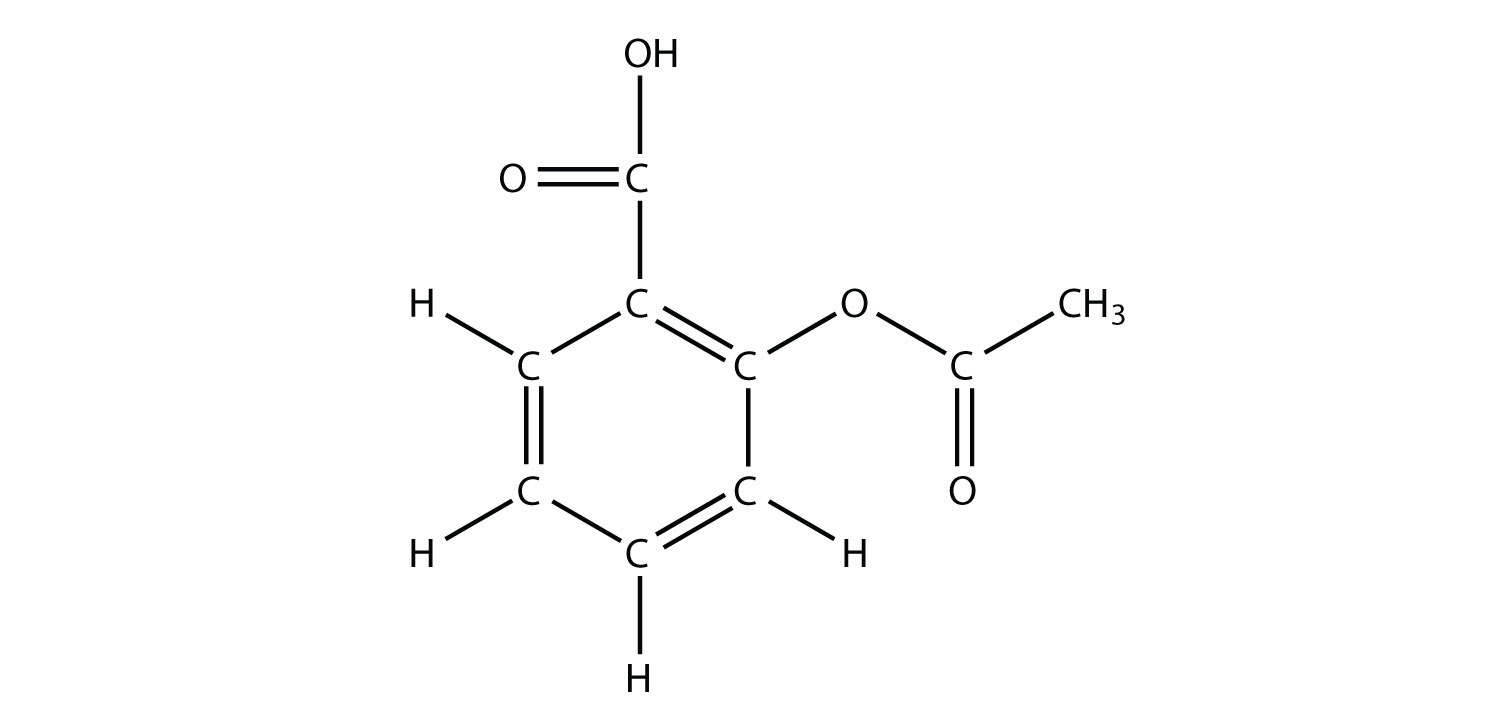
Skeletal formula.

Structural formula.
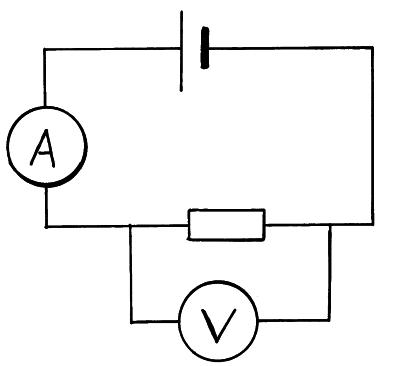
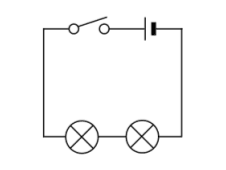
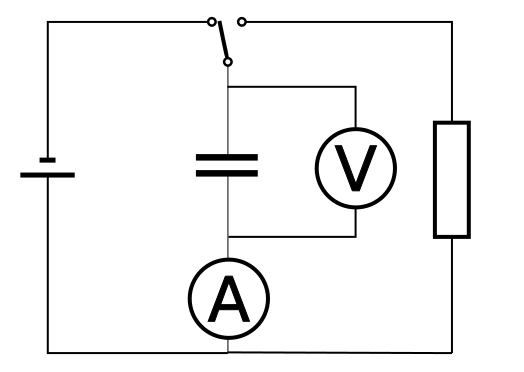
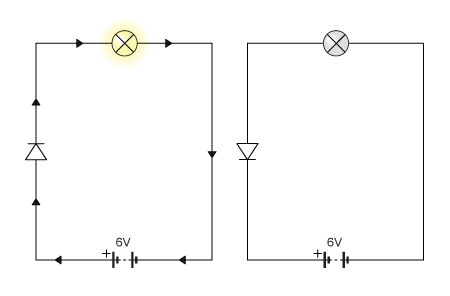
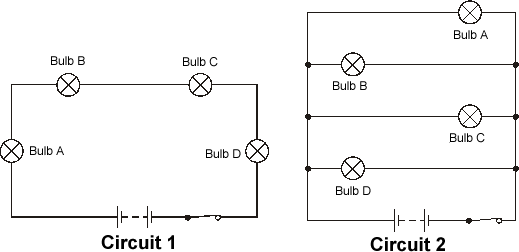
Physics: Electric Circuits Examples
Future: Other Subject Areas
Automatic Generation of Accessible SVG
- Start with (bitmap) images of diagrams or some graphical specification
- Understand their content
- Enrich information specifically for teaching
- Generate “content-heavy” SVG
Do all this fully automatically without user interaction.
As example I will use Chemistry.
Procedure
Input: A bitmap image of a molecule diagram
- Image analysis and recognition
- Generation of annotated SVG
- Semantic enrichment
- Accessible diagram via browser front-end
Image Segmentation
MolRec system implemented for diagram recognition on patent databases
- Initial preprocessing: Binarisation, noise reduction…
- Connected component extraction and labelling
- Optical Character recognition and removal
- Separation of bond elements
- Walk skeleton diagram structure
- Identify and break junction points
- Result is a set of geometric primitives:
Character groups, lines, circles, triangles
Diagram Recognition
Rule based system
Rewrites bag of geometric primitives into a graph representation
Example:
- Let (l_1, l_2) be distinct line segments of a minimum length.
- If (l_1) is nearly parallel to and in a neighbourhood of (l_2).
- No other line segment is nearly parallel to (l_1) or (l_2).
- Then ((l_1,l_2)) form a double bond.
single

double

triple

wedge

dashed wedge

wavy

- Result is a Chemical Markup File (CML or MOL)
SVG Generation
Many solutions for generating SVG from chemical markup
But they only draw!
And in the process destroy any structure or chemical knowledge
Build our own SVG generator with emphasis on
- Grouping meaningful units together (e.g., double bonds)
- Retaining names given to components in the chemical markup (IDs of atoms, bonds, etc.)
Result annotated and grouped SVG
Semantic Enrichment
Take basic chemical markup: Enrich it with derived knowledge and structure it accordingly
Detect major building blocks of the molecule
- Aliphatic chains
- Ring systems: Isolated and fused
- Functional groups
Order blocks and atoms by chemical conventions
Naming and description
- Cactus webservice
- Basic descriptions via atoms, bonds, substitutions
Abstraction Graph
Represent molecule as multi-layered graph
3-4 layers of abstraction
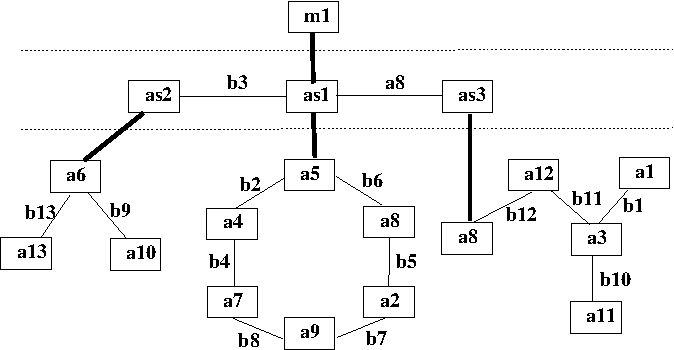
Molecule
Block
Atom
Additional layer in case of fused ring systems
Result semantically enriched CML File
Web Accessibility Support
- Simple navigation model with arrow keys
- Screen Reader Support:
- Generate speech output on different levels
- Display of speech output using subtitling
- Low Vision/Learning Disability Support:
- Highlighting of inspected components
- Optional zooming and magnification of components
- Changing contrast, colour configurations
- I18n support
Interactive Session 1: Examine 3 Diagrams
We will now work with three accessible diagrams:
- Chemistry: Examine Aspirin molecule at https://progressiveaccess.com/chemistry/generic.html?mole=data/aspirin-enr
- Physics: Examine the circuit at https://progressiveaccess.com/chemistry/generic.html?mole=data/physics/Capacitor_resistor_series
- Statistics: Examine the boxplot at https://progressiveaccess.com/chemistry/generic.html?mole=data/boxplots/Ozone
Each page contains the key for explorer and should be pretty self-explanatory.
Interactive Session 1: Using Web accessible diagrams
- Please go to one of the diagrams
- Focus on the diagram
- Press
<A>to enter navigation mode - Navigate with the arrow keys
<Down>Explore next lower level in the diagram.<Up>Move up one level.<Right>Navigate the diagram forward.<Left>Navigate back in the diagram.
<X>Toggles explanation mode between expert and novice.<Escape>Lets you leave exploration mode.
Generating Accessible Diagrams
- We provide a simple web front end to generate accessible diagrams
- The idea is to upload A bitmap image or a specification code (in the case of chemistr diagrams)
- Then after a little while get the accessible diagram
User Workflow
- Upload the image or code
- Have it recognised
- Navigate the recognised image
- Alternatively:
- Download the recognised image
- Possibly print it on an embosser.
Interactive Session 2
- Go to https://demo.progressiveaccess.com/v1
- Log in with the credentials
- Username:
demo - Password:
London123Bridge
- Username:
- Choose the chemistry demonstration link
- You will see a number of radio button choices and input fields.
Interactive Session 2: Task
- Go to the Wikipedia page for Paracetamol.
- Find either Smiles, Inchi or InchiKey in the knowledge box.
- This is the box on the top right of the page.
- Note that these identifiers are hidden and can be revealed with a show button.
- Copy the respective identifier, make sure to copy it fully!
- Enter the key into the input box of the our page.
- Choose the correct radio button and hit submit.
- After a while you should see the navigatable diagram.
- Examine it.